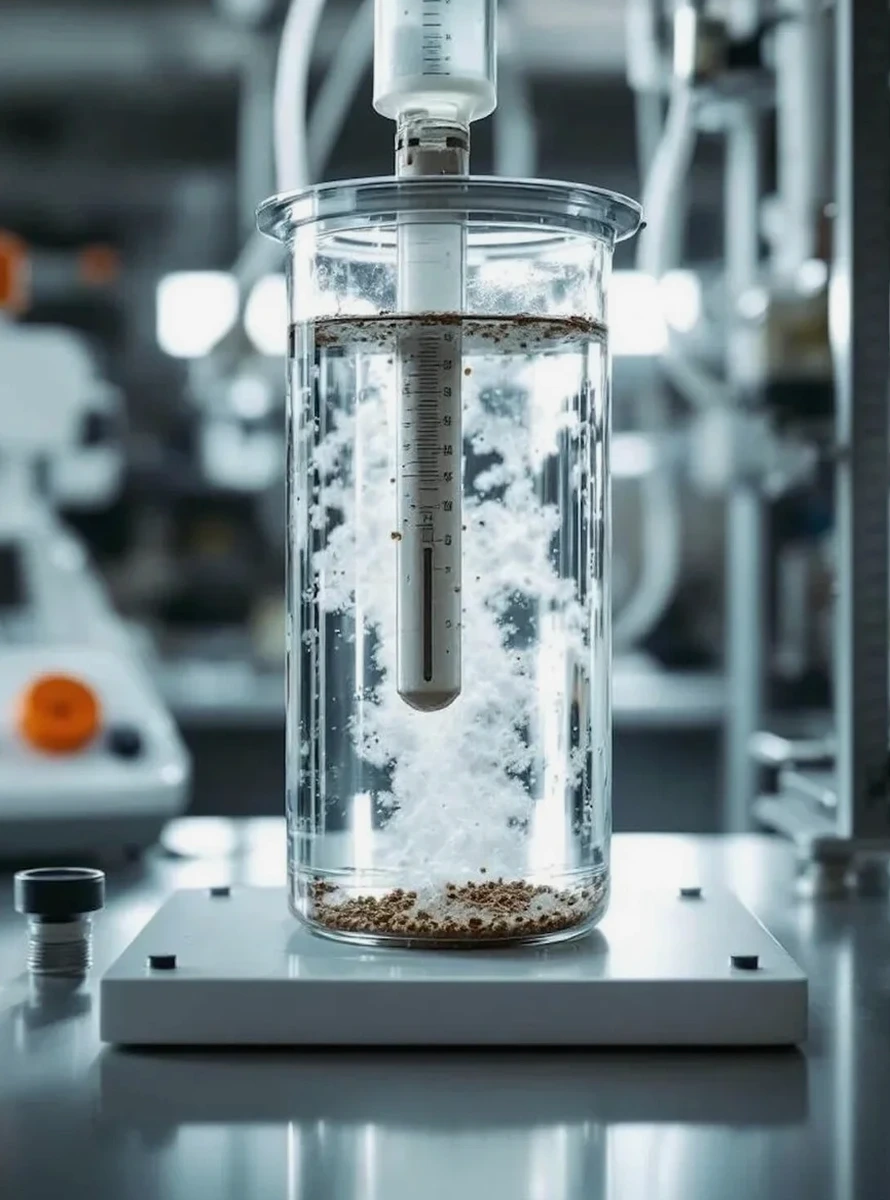
In Toowoomba, the difference between a stable pavement and a prematurely cracked surface often comes down to the percentage of fines passing the 75-micron sieve. Our laboratory team sees this routinely with the region's deeply weathered basalts and the reactive clay bands that run through the eastern suburbs. A complete grain size analysis, combining mechanical sieving with a hydrometer sedimentation test, quantifies not just the sand and gravel framework but also the silt and clay fraction that governs drainage and shrink-swell potential. On projects along the Warrego Highway upgrade corridor, this data pair is essential for selecting fill that meets Transport and Main Roads specifications. We run the full curve from 75 mm down to 2 microns because skipping the hydrometer step on basalt-derived residual soils routinely misclassifies the material, and that error propagates directly into earthworks cost overruns and pavement design assumptions. For road base verification near the Toowoomba Bypass, a CBR road test calibrated against the particle size distribution ensures the structural layer meets the soaked strength targets required by Queensland standards.
A well-graded gravel with a uniformity coefficient above 4 and a gradation coefficient between 1 and 3 packs into a dense, load-bearing skeleton—this is what we verify grain by grain.
Scope of work
A recent project on the escarpment edge required classification of a silty clay fill that was behaving differently in summer versus winter. The combined sieve and hydrometer analysis revealed a 38% clay fraction, predominantly kaolinite with some smectite, which explained the seasonal volume change. The full particle size distribution curve is generated per AS 1726 procedures: we oven-dry the sample, run it through a stack of square-aperture sieves from 75 mm down to 75 microns, then disperse the minus-75-micron material in a sodium hexametaphosphate solution for hydrometer readings at standardized time intervals over 24 hours. Temperature correction is applied at each reading because the laboratory ambient in Toowoomba can swing 8 degrees between morning and afternoon. The resulting curve gives the D10, D30, D50, and D60 values that feed directly into uniformity and gradation coefficients. These numbers determine whether a gravel is well-graded for road base or gap-graded in a way that invites instability. On the same escarpment project, the
Atterberg limits were run in parallel to correlate the clay percentage with the plasticity index, and a
Proctor compaction test established the moisture-density relationship for the same fill material, giving the contractor a complete picture of compaction behavior tied to the gradation curve.
Area-specific notes
The basaltic red clay soils of Rangeville and Middle Ridge behave fundamentally differently from the alluvial silts found near Gowrie Creek on the western side of Toowoomba. In the eastern suburbs, the clay fraction can exceed 45%, and the hydrometer curve often shows a bimodal distribution—coarse silt and fine clay with little in between—which creates a soil structure prone to internal erosion when saturated. Over on the Gowrie Creek floodplain, the gradation shifts toward poorly graded fine sands and silts with uniformity coefficients below 3, meaning they densify poorly and can liquefy under cyclic loading if saturated. Missing the hydrometer analysis in either zone results in a classification that looks like low-plasticity silt on paper but behaves like a reactive clay in the field—or vice versa. For sites near the Lockyer Valley geological boundary, the particle size distribution changes within 200 metres laterally, and a CPT test correlated with the laboratory gradation curves helps track that stratigraphic variability without excavating a dozen test pits.
FAQ
Why do I need the hydrometer part and not just a sieve analysis?
The sieves stop at 75 microns—everything finer passes through and gets reported as a single percentage. In Toowoomba's basalt-derived soils, that minus-75-micron fraction can be anywhere from 20% to over 60% of the total sample. The hydrometer separates that mass into silt (75 to 2 microns) and clay (below 2 microns). The clay percentage is what drives reactivity, shrink-swell behavior, and drainage characteristics. Without it, a highly reactive clay could be misclassified as a stable silt, and your foundation design would be based on incorrect assumptions.
How much sample material do you need for a full grain size analysis?
For a combined sieve and hydrometer test on fine-grained soil, we need approximately 500 grams of dry material. For granular road base or aggregate where the maximum particle size exceeds 19 mm, we require around 5 kilograms to ensure the coarse fraction is representative. Samples should be sealed in a plastic bag immediately after extraction to preserve field moisture, and we can accept material delivered to our laboratory or collected from your Toowoomba site by prior arrangement.
What does a grain size analysis cost in Toowoomba?
A combined sieve and hydrometer analysis typically ranges from AU$180 to AU$250, depending on whether it is a full curve with hydrometer or a sieve-only test on clean granular material. The exact price depends on the number of samples and the required turnaround time. Contact us with your project specifications for a firm quote.
How long does it take to get results from the laboratory?
The hydrometer sedimentation phase alone requires a minimum of 24 hours of controlled-temperature readings. Including sample preparation, oven-drying, sieve shaking, and data reduction, the standard turnaround for a combined sieve and hydrometer report is 3 to 4 working days. We can expedite sieve-only analyses for road base materials to 24 hours when project schedules demand it.